For most project risk managers, the real risk isn’t buried in a spreadsheet. It’s in the chaos behind the scenes—the invisible work of chasing down inputs, consolidating mismatched formats, and trying to tell a coherent story to leadership with incomplete or outdated data.
Risk management isn’t simple. It requires risk professionals to become generalists and specialists simultaneously—to understand causes, consequences, controls, and costs across every part of a project.
And unlike the models we manage, our own critical path rarely feels stable. Risk managers spend too much time manually collecting and reworking data—sometimes repeating the same tasks quarter after quarter.
The question is: How do we manage the risk process without letting it manage us?
What makes risk management so difficult?
The complexity isn’t just technical—it’s operational. Today’s project risk managers are expected to:
- Identify risks across the enterprise
- Assess impacts across cost, time, reputation, environmental, health and safety, and more
- Delegate actions to the right teams
- Understand evolving control environments
- Recommend effective mitigation strategies
- Present findings in a format executives can trust and act on
All of this depends on one thing: reliable, up-to-date data. And that’s where most workflows fall apart.
Most of the friction begins with information gathering. How do you pull insights from dozens of teams? What happens when inputs come back unstructured or incomplete? And how do you translate all of that into a report a stakeholder can actually use?
Peer insights: The daily struggle behind risk reporting
We asked seasoned risk professionals where their biggest challenges lie. Their answers were strikingly consistent:
- Consolidating risk across multi-stakeholder environments
- Providing confident, data-backed recommendations
- Extracting good data from the line of business
- Spending 4+ hours per week just building stakeholder visuals
- Navigating the discomfort of sharing negative forecasts with execs
- Being forced to “know a lot about a lot” to pull the risks and controls out from different groups’ worlds
These are not fringe cases—they’re the daily reality for risk managers working across complex, distributed project environments.
The three foundational problems
Three core problems for project risk managers are seeking, collecting, and uncovering good data. In the sections that follow, we’ll break down each challenge—and show how Predict! is purpose-built to solve them.
Problem 1: Seeking, collecting, and uncovering good data is difficult
Most project teams have some version of a risk register, but they’re usually stuck in Excel, buried in SharePoint folders, and siloed across functions. That makes it nearly impossible to roll up insights or share status without stitching together dozens—or even hundreds—of files. And whether it’s through spreadsheets, workshops, or interviews, getting good information from stakeholders remains painfully manual.
- Excel registers lack clarity and overwhelm non-risk analysts.
- Workshops are high-quality but costly, and people hesitate to raise concerns in front of leadership.
- Interviews are effective but completely unscalable.
As a result, 50% of risk managers spend a large portion of their time on manual, repetitive tasks—and 80% report having to rework inputs even after collection, according to Electro IQ.
Most are stuck relying on Microsoft Office tools that don’t provide role-based access, revision history, or proper audit trails.
The solution
Predict! changes this with a central repository that brings together enterprise, portfolio, and project-level risks, controls, actions, and assessments into one interactive, enterprise-wide system. You can zoom into a project-level view (like “Project A”) or aggregate risks across portfolios, departments, and business units—without managing a hundred spreadsheets.
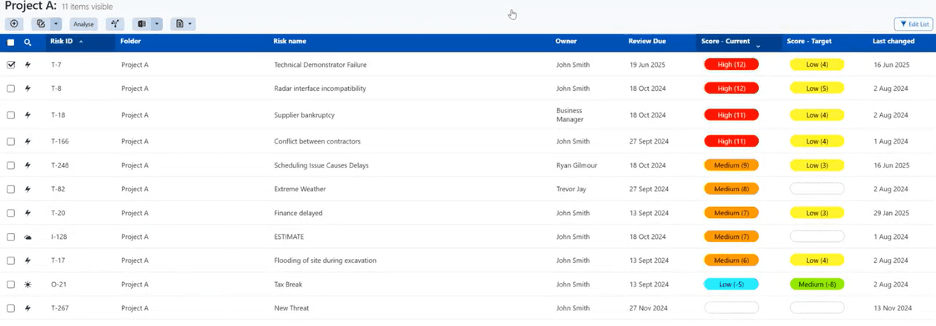
Example of an in-depth look at Project A in Predict!
Take the example of a “technical demonstrator failure” risk event. In Predict!, you don’t just see the event—you see:
- Its lifecycle and owner
- Where it lives in the enterprise
- The causes and consequences of the risk (reinforced visually with bow tie diagrams)
- Linked controls categorized as preventative, detective, or reactive
- An actionable plan: who owns it, what it costs, and when it’s due
- The current assessment across multiple impacts (time, cost, performance, environmental)
The system’s heat map grid shows risk severity—like a score of 12 in this case—and even highlights potential opportunities, not just threats. And because every update is saved with full revision history and audit trail, your reports are always built on real-time data.
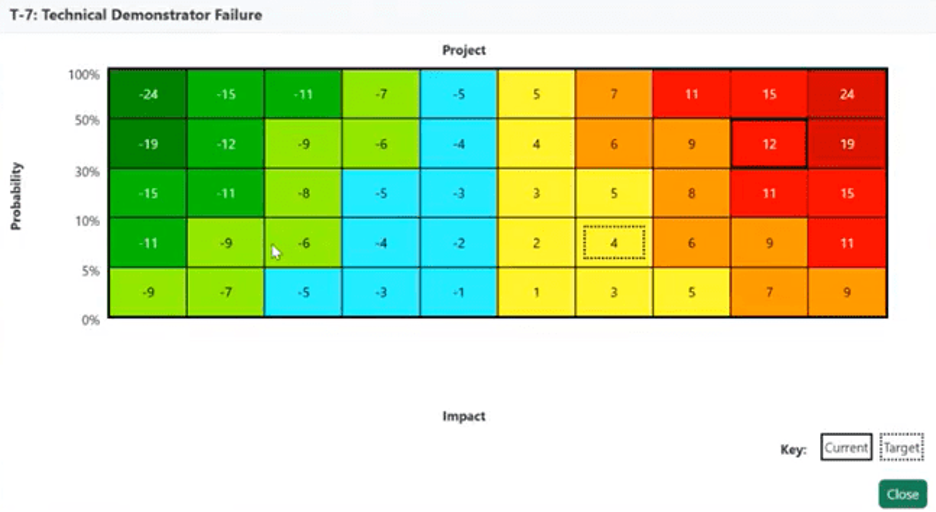 Example of a project heat map within Predict!
Problem 2: Consolidating and analyzing risk data is difficult for a single entity, and even hard with several
Once the data comes in, it’s often unstructured and inconsistent. That means hours spent trying to translate it into a format executives can actually understand.
Reports that should take minutes often take days. Risk managers report spending 12+ hours per quarter building dashboards for board-level meetings.
Without a centralized system, there’s no clean way to ask:
- How does one control affect overall risk?
- What if we implement this mitigation next quarter instead of now?
- What’s the actual impact on our risk exposure?
Scenario planning becomes guesswork.
The solution
Predict! makes this kind of thinking easy to visualize:
- Bow tie diagrams show causes on the left, consequences on the right, and the controls/actions layered across the middle—along with clear ownership.
- Risk Visualizer lets you categorize risks, compare exposure across units, and filter by any attribute.
- Predict Risk Analyzer performs full Monte Carlo simulations and scenario modeling, generating outputs like confidence distribution graphs, end-date projections, and trend analysis reports.
And it’s not limited to one ecosystem. You can import your existing schedules from Microsoft Project, Primavera, or Deltek Open Plan directly into Predict! to align modeling with your actual project plans.
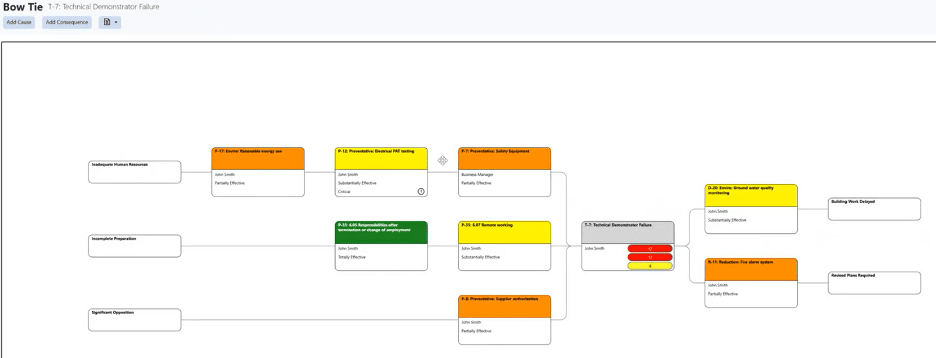
Example of a bowtie report in Predict!
Problem 3: Executing risk treatment, orchestrating collaboration, and bridging the gap between workshops
This might be the most overlooked challenge of all: risk management doesn’t end with identification—it lives in the execution. But too often, the systems for tracking actions, assigning owners, logging progress, and linking controls live in different silos.
In a perfect world, risk registers, control tests, and treatment plans would live side by side—and speak the same language. But most organizations are still juggling Excel files and access databases that don’t talk to each other.
What you end up with is this: someone asks, “Where are we with that mitigation?” And the answer is… “Let me check with so-and-so.” No audit trail. No update. Just a gap.
The solution
Predict! solves this by addressing actions alongside risks and controls. Each action is linked directly to its risk driver, with timelines, budget allocation, and real-time status updates.
The result: when someone asks for an update, you don’t go searching. You show the audit trail, the logs, and the actions surrounding the risk.
Because risk management doesn’t happen in a spreadsheet. It only happens when people take the necessary action to respond.
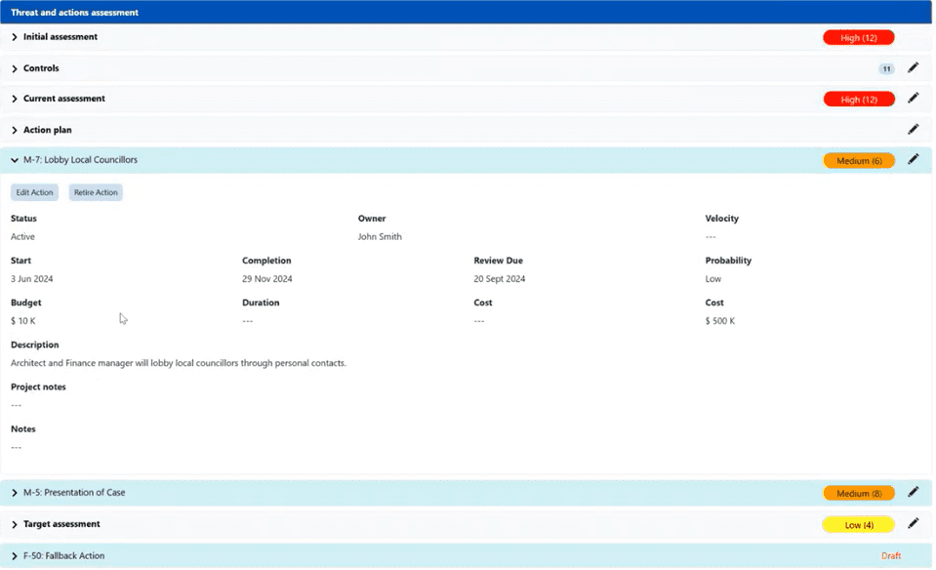
Example of risk actions in Predict!
What top programs are doing differently
We’ve already looked at how Predict! helps streamline input, structure risk data, and produce meaningful insights across an enterprise. But when you take a step back, the real value of Predict! becomes clear: it connects the dots across every part of your risk management process.
When we talk to top-performing teams, here’s what they consistently point to:
- Central repository for risk, controls, and mitigation activity data
Predict! moves you away from disconnected spreadsheets and shared drives by creating a single, centralized system for all your risk data. From risk events and control environments to mitigation actions and assessments, everything lives in one place—organized, accessible, and enterprise-ready. You can view risks at the project level or roll them up across departments and portfolios without managing hundreds of separate files. - Accountability through guidance and notification
Instead of chasing updates over email or phone, Predict! uses built-in notifications and embedded instructions to guide stakeholders through their tasks—whether it’s a risk reassessment, a control evaluation, or updating a mitigation plan. It’s like running a risk interview at scale. Role-based access and audit trails keep everything visible, traceable, and on schedule. - Powerful analysis tools
Predict! turns input into insight with scenario modeling, risk heat maps, and dynamic bow tie diagrams. You can visualize causes and consequences, assess control effectiveness, and identify gaps—all in a fully interactive interface. Tools like Predict Risk Analyzer let you run Monte Carlo simulations and perform schedule and cost risk assessments using real project files from Microsoft Project, Primavera, or Open Plan. - Fully automated reports
Reports are built for clarity, not formatting. With built-in visuals like dashboards, trend lines, and mitigation summaries, Predict! turns raw data into ready-to-share insights—automatically. You’re not spending hours creating graphics or reworking slides. You’re generating executive-ready reports in a few clicks, always backed by the most current data.